Digital businesses have been growing in the last decades due to the Technological Revolution and because society is changing towards the virtualization of services. This dynamic has generated a massive volume of data and information about everything that can be tracked online, and user behavior on digital media or brand performance on web platforms or social media is not an exception.
When we try to understand user behavior, the data to track can be of many types, so we should select the ones that adjust to the company’s market maturity and niche.
Based on a final objective set, one must choose correctly what needs to be measured. It is necessary not to lose the brand's direction in the digital world because it is from here that the strategy is deployed.

From planning a goal, choosing a metric, measuring its performance, and implementing actions based on data, every step of our strategy should be taken within the framework of the so-called digital marketing, a set of tactics focused on promoting a brand online.
In digital marketing and the market at large, processes have been evolving thanks to IT usage versatility. These technological changes allow us to identify the customer lifecycle stage easily.
The customer lifecycle includes those who do not know about the business and those who can now be its promoters. This information allows us to focus better on customers to whom the brand offer is addressed and to create added value through strategies for developing a brand identity that hooks the audience and pushes them to continue the relationship.
Thus, before creating strategies, measuring numbers, and taking action, one must identify the type of business relationship the brand serves, whether B2C or B2B.
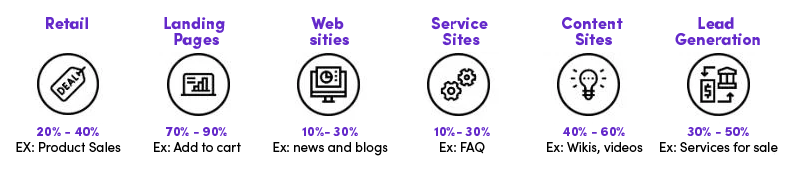
From a macro perspective, the strategies to achieve a goal in digital marketing are similar for both B2C (Business to end Consumer; e.g., a cookie brand focused on the fitness sector for athletes) and B2B (Business to Business; e.g., a concrete supplier that offers the material to construction companies) markets. However, one must consider the market niche in which the brand operates and the business maturity to choose the metrics that will support the achievement of the general objective. Some differences between these two types of business are shown below:
| B2C | B2B |
|
|
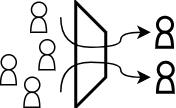
Once the type of business is identified, it is necessary to know its level of market maturity and relationship with customers. The following graph shows how those relationships can occur between the brand lifecycle and the customer journey.
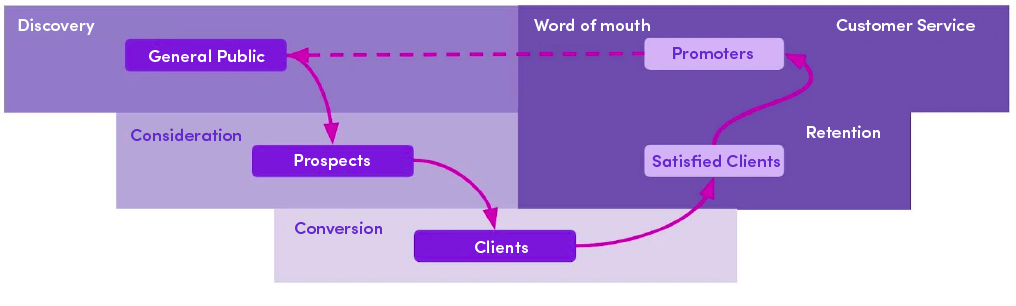
Considering the dynamics in each type of business, a customer lifecycle arises in which the customer interacts with each phase of the funnel (as detailed later on).
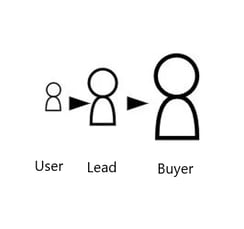
Initially, in the discovery phase, users are unknown to the brand and vice versa, hence the importance of exposure to reach more people. The second place is consideration, where the audience becomes a potential prospect to engage with the brand. Then in the conversion phase, the transition from potential customers to actual customers occurs. Once you get a customer, retention or loyalty strategies become essential to sustain possible future conversions and save costs (keeping a loyal customer is more cost-effective than finding a new one). Finally, customer service is positioned, where the main objective is to satisfy the user in their purchasing process so that the trust in the brand makes them even a promoter of it, with actions such as word of mouth.
It is said that this is a lifecycle because once its first iteration with a loyal customer ends, it is possible to start again with a new conversion to attract potential new customers or leads from that user loyalty.
With clarity about the business maturity, it is possible to address what metrics can be used in each brand phase.

DISCOVERY
In the discovery phase, tracking the activities carried out for brand exposure and awareness will be crucial.

-
Impressions (Social Media and Websites)
-
Reach

Knowing the reach of posts can provide insights into the target market and evaluate the effectiveness of advertisements regarding platforms and the type of content used.
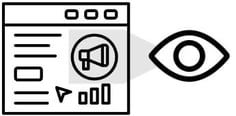
CPM is a metric that is often useful. However, there is no conversion in the achieved impressions, which means its impact is not on return on investment (ROI). Its main objective is to increase brand awareness among a wider audience. If the goal is to increase ROI, other metrics, such as CPC (Cost per Click) measured through CTR (Click-through Rate), are more appropriate. This will be further explored in the Interest stage.
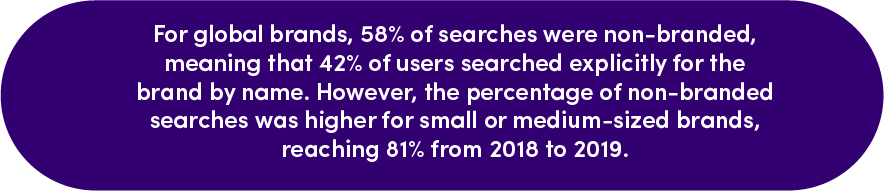
Non-Branded and Branded Search
Non-Branded search refers to terms related to the brand’s economic activity or name that could lead to the website. These are searches where users are not looking for the brand but are interested in the broader industry or topic.
Branded search, on the other hand, refers to specific mentions of the brand in search queries. These are searches where users are specifically looking for the brand by name.
You can consult the search terms using the Google Search Console for Branded Search or Google Trends for Non-Branded Search. These tools provide insights into the search volume and popularity of specific terms related to your brand or industry, allowing you to understand your brand’s level of interest and discoverability online.
At this point, several marketing options can be chosen to raise greater brand awareness. These options include content marketing (offering the audience information and guidance related to their search intent or purchasing needs), social media usage (creating and sharing content, which can help generate a community and receive recommendations from users who find value or affinity with what the brand promotes), advertising (raising basic awareness about the brand’s existence, what it offers, and its target audience, reaching a more comprehensive and potentially interested audience), and SEO optimizations (crucial for improving brand visibility in search engine results. By implementing techniques such as keyword research, content optimization, and website structure, the likelihood of the brand appearing in relevant user searches can be increased).
CONSIDERATION
In the consideration stage, the user initially understands the brand’s offering. They also feel identified and actively engage in interactions, such as interacting with content.
This stage is crucial because it is where the audience connects and finds added value to the point of considering becoming a customer. Therefore, it is important to highlight the solution to the user’s real problem, the benefits, added value, payment options, satisfaction guarantees, etc., as these features give the customer the certainty to decide to purchase the product or service. Some suitable metrics for this phase can include the following:
-
Referral Traffic:
-
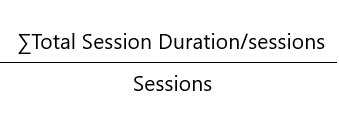
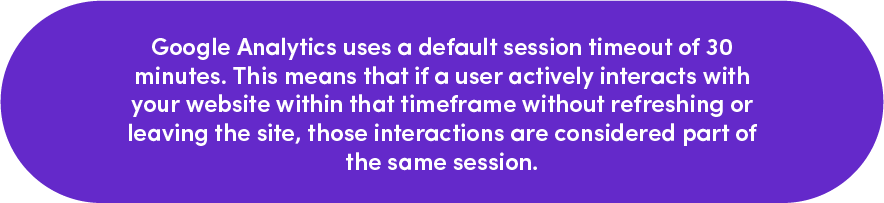
Sessions:

-
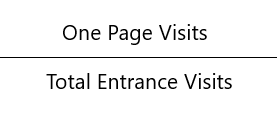
Bounce rate:
-
Product/Service views:
Sometimes, tracking users’ views or interactions with specific product or service pages or content is important. This metric can represent a significant conversion point for lead generation efforts.
You can gain insights into user interest and engagement with your offerings by tracking product or service views. It helps you understand which products or services attract attention and raise interest among your audience.
-
Cost Per Click (CPC):
-
Click Through Rate (CTR):
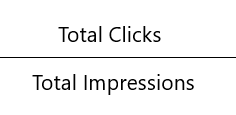
Other metrics used during the conversion stage include those that, through informational materials about the product/service, allows for the measurement of content downloads, multimedia views, surveys, or feedback.
Additionally, for email marketing strategies, metrics such as email open rate and traffic generated from this channel can be measured as indicators of the effectiveness of these communication and marketing mechanisms.
CONVERSION
In the conversion stage, the user’s entire journey culminates in the desired action the brand wants: completing a form, registering for an event, making a purchase, etc. Therefore, the following factors should be considered:
-
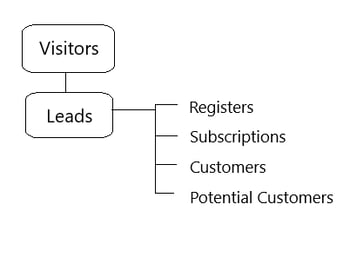
Leads:
-
Customer Acquisition Cost (CAC):
-
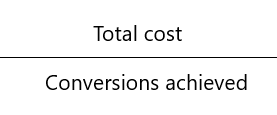
Conversion Rate:
The conversion rate is calculated by dividing the number of conversions by the total number of visitors and multiplying it by 100 to get a percentage.
Monitoring and optimizing the conversion rate is crucial for evaluating the effectiveness of your website, marketing campaigns, and user experience. It helps identify areas for improvement, such as optimizing landing pages, simplifying the conversion process, or refining the messaging and call-to-action to increase the likelihood of conversions.
-
Cost Per Action (CPA):
It is the amount an advertiser pays for each user interaction that creates value for the company, such as a lead, form submission, purchase, etc.
CPA is a metric used in digital advertising to measure the cost-effectiveness of specific actions or conversions. It calculates the average cost incurred by the advertiser for each action taken by a user.
CUSTOMER LOYALTY
After a transaction has been completed, there is a phase that not all companies engage in, but it can create significant value. It is the phase of customer retention or loyalty.
“Acquiring a new customer is more costly than retaining existing customers.”
Customer loyalty brings cost savings, builds trust, and fosters long-term business relationships. The objective is to keep the customer satisfied even after their purchase. Some ways to enchant customers include satisfaction surveys, suggestion boxes, loyalty programs and benefits, and valuable post-purchase content. The metrics used to measure customer loyalty can consist of the following:
-
Customer Lifetime Value (CLTV):
Customer Lifetime Value is a forecast of the profit a company expects from a customer over the entire duration of their relationship with the company. According to Econsultancy and RedEye, 91% of organizations state that predictive AI analytics is the most powerful technique for improving CLTV. To calculate CLTV, the following formula is commonly used:
-
Average Purchase Value
The total value of all customer purchases is divided by the number of acquisitions in that period.
-
Average Purchase Frequency
The number of purchases in the same period is divided by the number of customers who made a transaction.
-
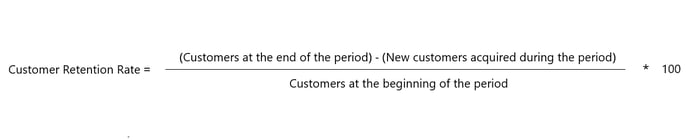
Customer Retention Rate
This metric evaluates the proportion of customers who continue their relationship with the brand to promote audience loyalty. It can be achieved through listening to feedback, personalized experience strategies, and improved customer service. It is calculated as:
-
Net Promoter Score (NPS)
Measures the customer experience and their likelihood of recommending the brand through a survey. The goal is to score the user’s rating on a scale of 1 to 10. The main question is, “Would you recommend this product/service/company/brand to a friend or colleague?”
If the response falls between 1 and 6, the customer is considered a detractor (unsatisfied customers whose negative experience would prevent them from giving a positive recommendation about the company). If the response is 7 or 8, it indicates a passive customer (their experience was completely average and met their expectations). If the answer is between 9 and 10, it designates a promoter customer (they are satisfied with the experience they had with the brand and are highly likely to recommend it).
How to calculate NPS.
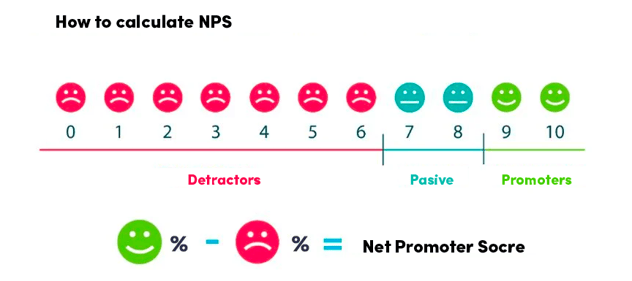
It is important to monitor NPS and the separate quantities of detractors, passives, and promoters to improve the entire customer service experience, from their first contact to the acquisition of the offering.
-
Email Unsubscribe Rate
When the brand’s audience no longer wishes to receive communications and unsubscribes from email distribution lists, it is considered an email unsubscribe. Calculating this rate requires tracking the number of subscription cancellations and the total number of emails sent. According to platforms like Campaign Monitor and Smart Insights, the average unsubscribe rate ranges from 0.1% to 0.5%.
-
CUSTOMER SERVICE
In this stage, the customer’s experience and satisfaction with the brand are measured, from communication to conversion, throughout the purchasing and post-sales experience. With this information, the user’s needs are thoroughly understood, and strategies are developed to improve both products/services and the assistance provided throughout the process.
When customers are satisfied with the brand experience, they are more likely to recommend it to others based on their positive experience, often through positive reviews. When a friend or acquaintance suggests a product/service, it becomes easier and more reliable to make a purchase decision based on that close person’s evaluation.
-
Customer Effort Score (CES)
Customer Effort Score measures how easy it is to resolve issues related to a product or service, using a rating scale from 1 to 10. According to a Harvard Business Review study, 94% of customers who had low effort in resolving their problems showed more interest in repurchasing from the same company.
-
New Customers Acquired through Referrals
By asking new customers how they have heard about the brand or through strategies like “refer a friend and get XX euros off,” which incentivize recommendations and allow tracking of users who have been referred.
-
Post-Chat Survey
Customer support chats are a typical channel for measuring the effectiveness of issue resolution. After the conversation with the customer service agent or chatbot, requesting the user to evaluate the interaction on a scale of 1 to 10 is common.
-
Exit Interviews
Exit interviews provide an excellent opportunity to identify why customers cancel their relationship with the company. Understanding these reasons makes it possible to prevent them and improve customer retention. Exit interviews typically involve a few targeted questions.
-
Satisfaction Level
The Likert scale is an instrument used to measure opinions, perceptions, and behaviors. It consists of a closed-ended question with specific response options that reveal customer satisfaction. For example, “How satisfied are you with the service provided?” with response options: Very satisfied | Somewhat satisfied | Neither satisfied nor dissatisfied | Somewhat dissatisfied | Very dissatisfied.
All these stages mentioned earlier are part of understanding the customer lifecycle. They provide real insight into the brand’s performance and relationship with the audience through measurement. This enables the evaluation of actions and making decisions aimed at increasing profitability, reducing costs, retaining users, and generating benefits.
By closely monitoring the customer lifecycle and analyzing the metrics associated with each stage, companies can identify opportunities for improvement, optimize their marketing and customer service strategies, and drive business growth. Understanding the customer journey allows for targeted and personalized approaches, resulting in increased customer satisfaction, loyalty, and, ultimately, higher revenues.
By continuously assessing the performance and impact of various initiatives across the customer lifecycle, companies can make informed decisions and adjustments to their strategies. This data-driven approach helps identify improvement areas, implement effective marketing campaigns, enhance customer experiences, and foster long-term relationships with customers.
Ultimately, comprehending the customer lifecycle and leveraging measurement allows organizations to align their efforts with customer needs, drive customer satisfaction, and achieve sustainable business growth.
REFERENCES
- Doppler, 2022. B2B vs. B2C ¿Cuál es la diferencia entre un cliente corporativo y uno masivo?
- SendPulse s.f. ¿Qué es Marketing B2C?
- DigiFianz, s.f. Descubre cuál es el funnel de marketing y de ventas para tu negocio.
- Lead Motiv, s.f. Analítica web: las 7 herramientas y 9 métricas más importantes.
- Yo pago por click, s.f. CPC, CTR, CPA, CPM, CPL ¿Qué significa todo eso?
- Google Analytics How a web session is defined in Universal Analytics.
- InboundCycle, ¿Qué es un lead, qué tipos hay y para qué sirven?
- NeilPatel, Bounce Rate: What Is It and What Is a Good Number?.
- Rubén Nañez, Qué es un Funnel de Ventas y para qué sirve [Etapas + Ejemplos].
Share this

Artificial Intelligence for Banks: five trends to watch out for
US Open Banking Outlook: Adoption, Benefits & Implications

We did it! Pragma became an AWS Gen AI Competency Partner